
Irving Texas community page
MEET YOUR LOCAL TEAM OF SAAVETX EF AMBASSADORS!
Sign up to be a part of the Irving community team

Puja Maharaj
WELCOME TO THE CITY OF irving PAGE! Here you will find helpful information about what saavetx ef is doing in your community.
COME BACK AND VISIT OFTEN TO get the latest updates about YOUR LOCAL ELECTIONS AND EVENTS!
Irving is a vibrant, growing city that is increasing in diversity every year! It’s so important that we increase civic engagement in our community and make sure our voices are heard at the ballot box!
In 2023, Irving TX had a population of 255k people.
Foreign-Born Population
2023 FOREIGN-BORN POPULATION 106k people 41.7%
2022 FOREIGN-BORN POPULATION 104k people 41%
As of 2023, 41.7% of Irving, TX residents (106k people) were born outside of the United States, which is approximately the same as the national average of 13.8%. In 2022, the percentage of foreign-born citizens in Irving, TX was 41%, meaning that the rate has been increasing.
Citizenship
2023 CITIZENSHIP 70.7%
2022 CITIZENSHIP 70.9%
As of 2023, 70.7% of Irving, TX residents were US citizens, which is lower than the national average of 93.4%. In 2022, the percentage of US citizens in Irving, TX was 70.9%, meaning that the rate of citizenship has been decreasing.
Race and Ethnicity
Asian (Non-Hispanic) 57.5k 22.5%
White (Non-Hispanic) 47.5k 18.6%
White (Hispanic) 46.2k 18.1%
Other (Hispanic) 34.7k 13.6%
Black African American 32.4k 12.7%
Household Income
MEDIAN HOUSEHOLD INCOME $79,641
NUMBER OF HOUSEHOLDS 94.3k
In 2023, the median household income of the 94.3k households in Irving, TX grew to $79,641 from the previous year's value of $76,686.
insurance coverage
Between 2022 and 2023, the percent of uninsured citizens in Irving, TX grew by 2.39% from 21.1% to 21.6%
21.6% Uninsured
49.2% Employer Coverage
13.4% Medicaid
6.27% Medicare
8.71% Non-Group
0.734% Military or VA
property
Median property value in 2023: $287,300
Median property taxes: $36,104
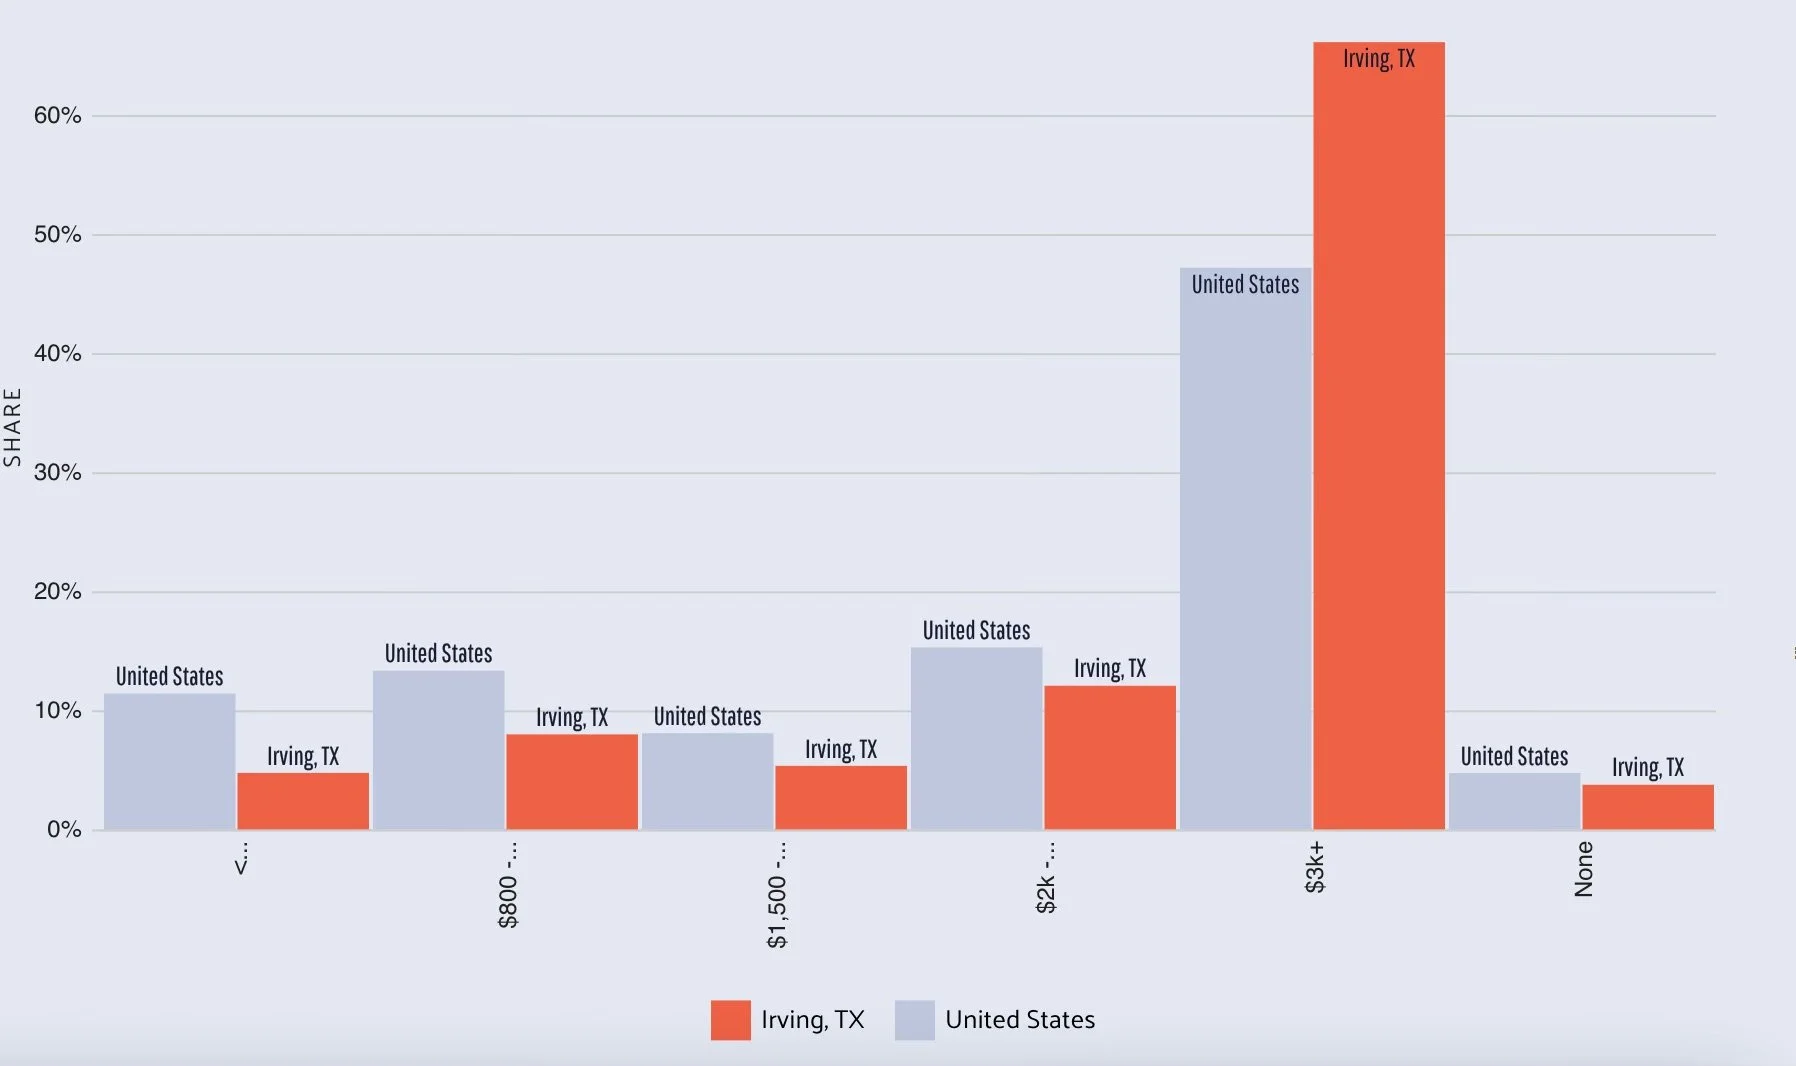
The following chart display owner-occupied housing units distributed between a series of property tax buckets compared to the national averages for each bucket. In Irving, TX the largest share of households pay taxes in the $3k+ range.
poverty
11% of the population for whom poverty status is determined in Irving, TX (27.8k out of 253k people) live below the poverty line, a number that is lower than the national average of 12.4%. The largest demographic living in poverty are Females 25 - 34, followed by Females 35 - 44 and then Males 25 - 34.
The most common racial or ethnic group living below the poverty line in Irving, TX is Hispanic, followed by White and Black.
Our team would love to meet you! Sign up now to be included in our network and learn more about your community and how you can shape the future of Irving!