
Garland, Texas COMMUNITY PAGE
MEET YOUR LOCAL TEAM OF SAAVETX EF AMBASSADORS!

Sumar Dey
WELCOME TO THE CITY OF GARLAND PAGE! Here you will find helpful information about what saavetx ef is doing in your community.
COME BACK AND VISIT OFTEN TO get the latest updates about YOUR LOCAL ELECTIONS AND EVENTS!
Garland is a vibrant, growing city that is increasing in diversity every year! It’s so important that we increase the civic engagement in our community and make sure our voices are heard at the ballot box!
In 2023, Garland had a population of245,298 people, representing a 0.521% increase in size from 2022. 81.1% of Garland residents are US citizens and Garland is home to almost 118,000 registered voters.
RACE AND ETHNICITY
3 largest ethnic groups in Garland:
White (Non-Hispanic): 60.2k ± 3.01k
Two Races Including Other (Hispanic): 57k ± 4.62k
Black or African American (Non-Hispanic): 37.5k ± 2.87k
Foreign-Born Population
In 2023, the most common birthplace for the foreign-born residents of Texas was Mexico, the natal country of 2,397,739 Texas residents, followed by India with 325,248 and El Salvador with 221,729.
Health
Between 2022 and 2023, the percent of uninsured citizens in Garland, TX grew by 2.41% from 25.2% to 25.8%.
insurance coverage
25.8% Uninsured
38% Employer Coverage
16% Medicaid
9.2% Medicare
10.3% Non-Group
0.638% Military or VA
property
Median property value in 2023: $248,900
Median property taxes: $49,809
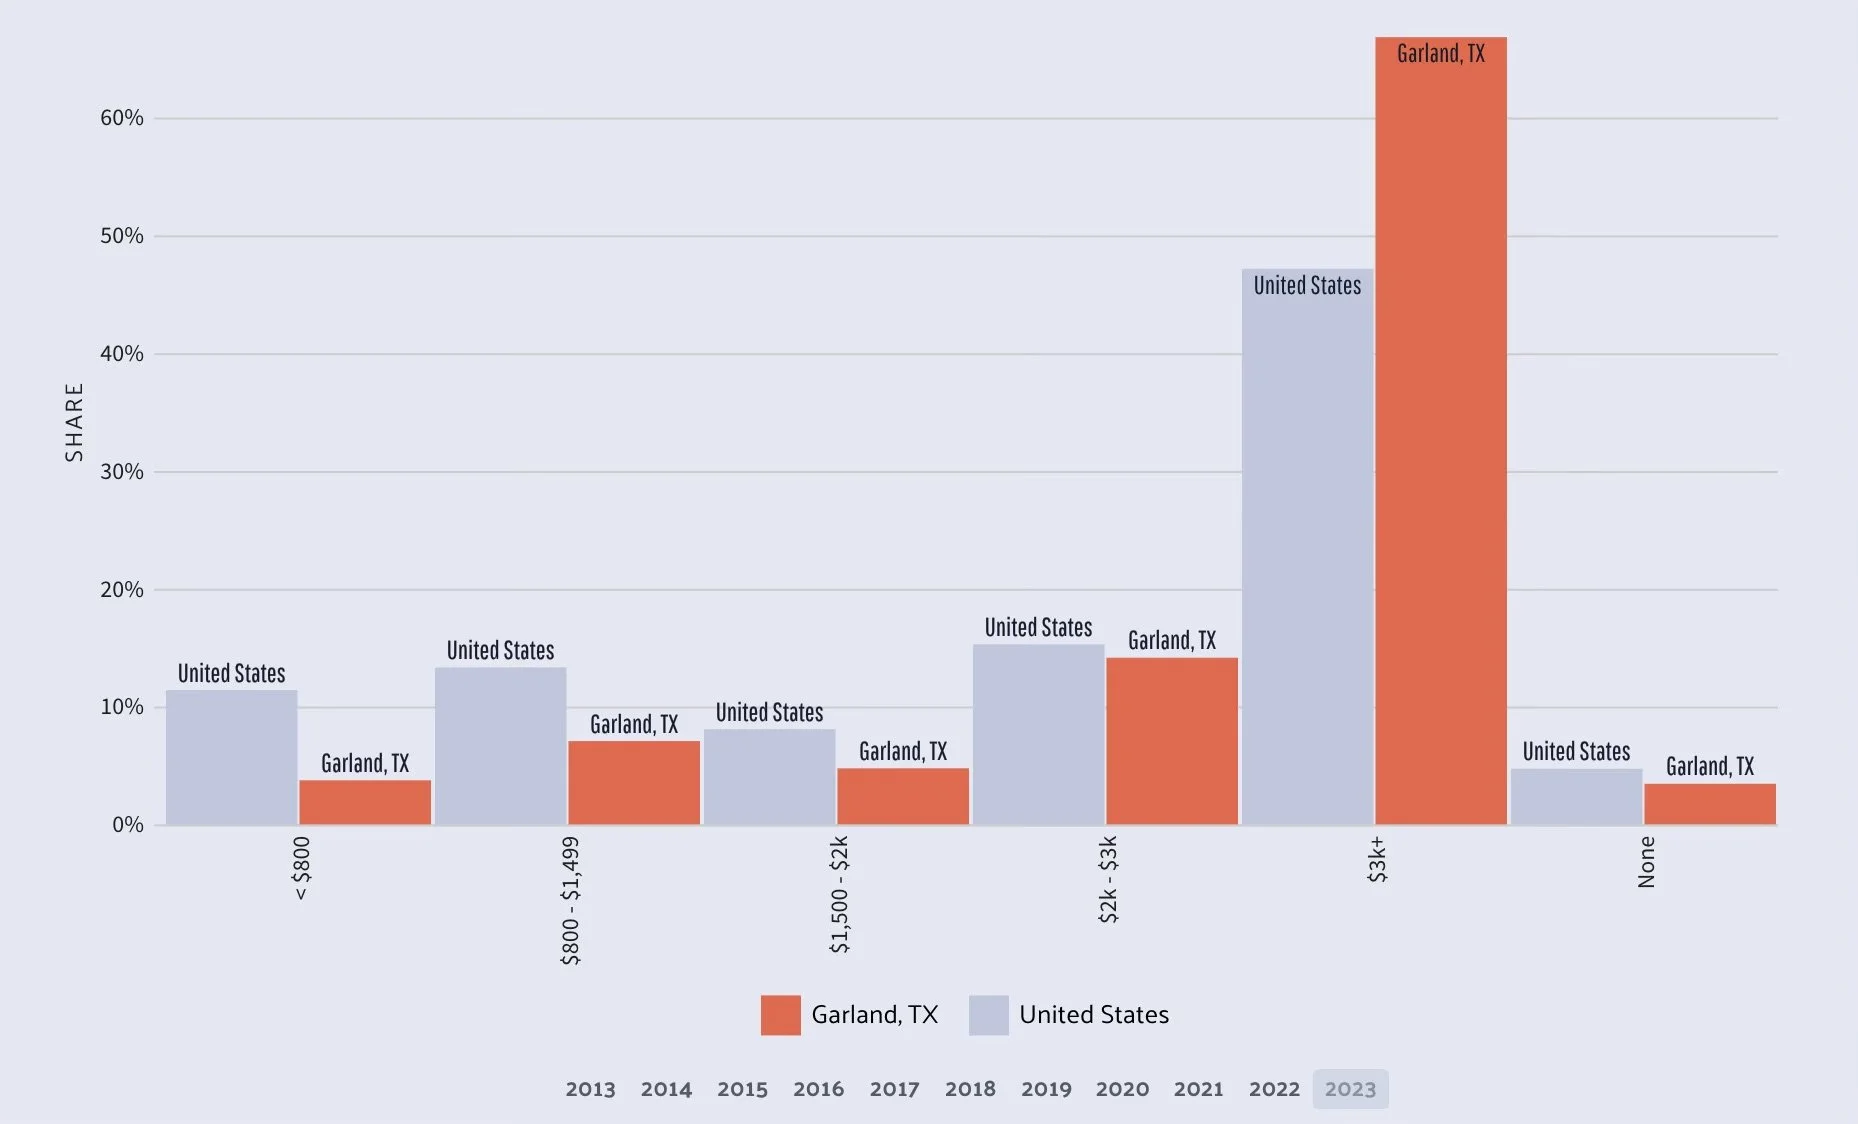
Owner-occupied housing units distributed between a series of property tax buckets compared to the national averages for each bucket. In Garland, TX the largest share of households pay taxes in the $3k+ range.
poverty
12.3% of the population for whom poverty status is determined in Garland, TX (30k out of 244k people) live below the poverty line, a number that is lower than the national average of 12.4%. The largest demographic living in poverty are Females 25 - 34, followed by Females 6 - 11 and then Males 6 - 11.
Education
The most common educational levels obtained by the working population in 2023 were High School or Equivalent (5.75M), Some college (4.93M), and Bachelors Degree (4.37M)
Our team would love to meet you! Sign up now to be included in our network and learn more about your community and how you can shape the future of Allen!